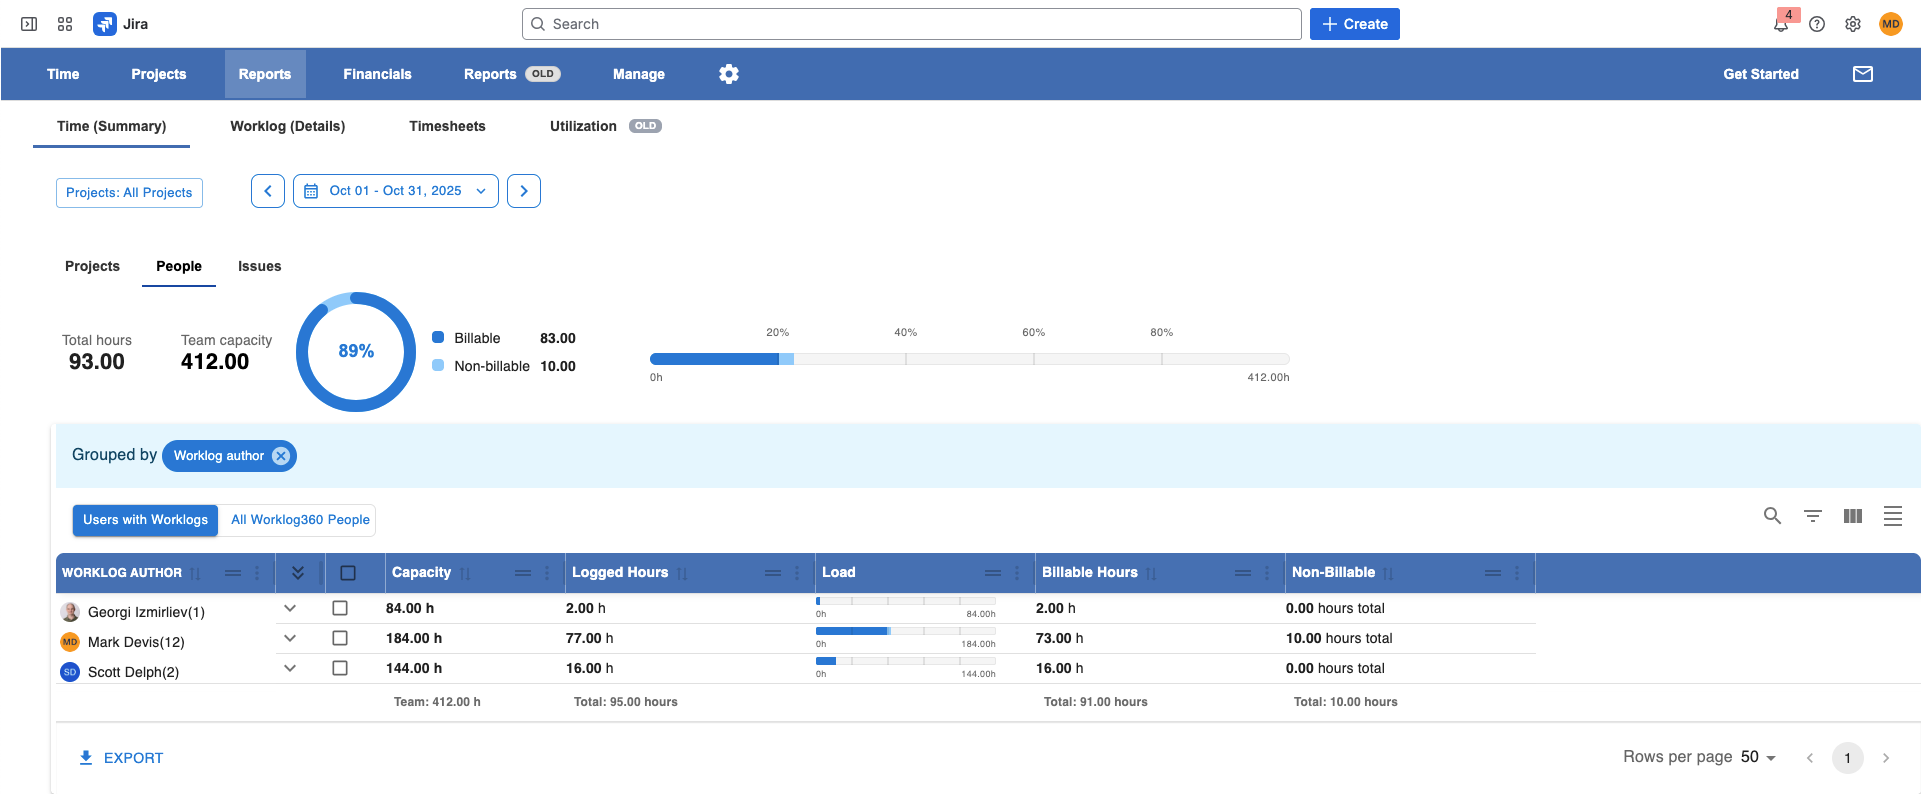
The People tab in the Time Summary Report provides a detailed overview of how each team member utilizes their time — comparing total capacity, logged hours, billable hours, and missing time.
It helps team leads and managers quickly identify underutilized or overworked employees and ensures accurate tracking of billable performance across the organization.
1. Main Filters
At the top, you can filter the report to focus on specific users or time periods:
-
People Filter: Choose to display all users who have logged time or everyone defined in Worklog360.
-
Time Range: Select the reporting period (week, month, quarter, or custom date range).
Tip: The report dynamically recalculates capacity, billable ratios, and totals based on your selected range.
2. Summary Chart
Below the filters, the report shows a visual breakdown of your team’s overall time utilization:
-
Total Capacity: The total number of hours all selected team members are expected to log within the chosen time range (based on their working hours and calendars).
-
Utilization Chart: A linear progress-style visualization showing:
-
Billable Hours (time generating revenue)
-
Non-Billable Hours (internal or non-client work)
-
Missing Hours (unlogged or underreported time)
-
This chart gives you an instant overview of overall time usage and how much of it contributes to billable work.
3. Detailed People Table
The table below provides a breakdown of time data for each individual user.
|
Column |
Description |
|---|---|
|
People |
Displays all users who logged hours in the selected time range. Optionally, you can switch to view all users defined in Worklog360 (even if they haven’t logged time). |
|
Logged Hours |
Total hours logged by the user during the period. |
|
Billable Ratio |
A line chart visualizing how each user’s logged hours compare to billable and non-billable time. |
|
Billable Hours |
Total number of billable hours logged by the user. |
|
Non-Billable Hours |
Total number of non-billable hours logged by the user. |
4. Customization Options
You can tailor the table to match your reporting needs:
-
Add or remove columns to show only relevant metrics.
-
Sort and group users by different criteria (e.g., department, team, role).
-
Filter users based on their time utilization (e.g., show only users with missing hours).
5. Export Options
Export your data for further analysis or sharing with other teams:
-
CSV Export — for lightweight data exports.
-
Excel Export — to perform deeper analysis or reporting outside Worklog360.
Summary
The Time Summary → People tab helps you:
-
Understand how each person uses their working hours
-
Track total capacity and identify unlogged time
-
Evaluate billable vs. non-billable utilization
-
Maintain visibility into team performance and workload distribution
This report is essential for capacity management, resource planning, and billing accuracy.