The Projects tab in the Time Summary Report provides a high-level overview of how time is being spent across your Jira projects.
It helps you analyze logged time, compare it with estimations, and track billable performance — all in one view.
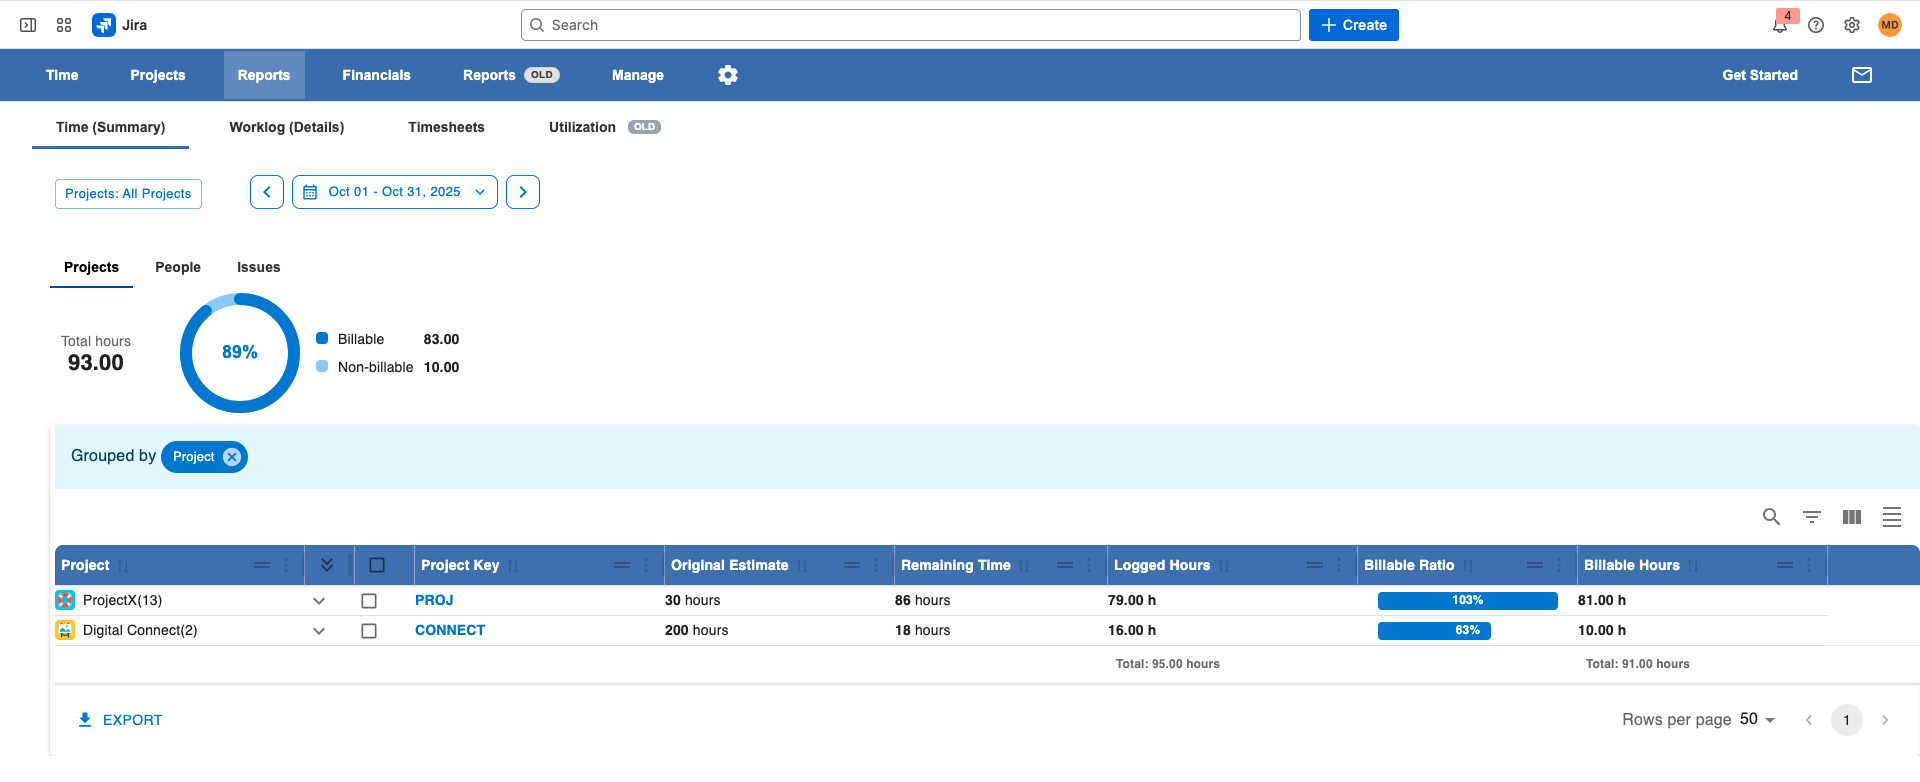
1. Main Filters
At the top of the report, you’ll find key filters that define your data scope:
-
Projects: Select one or multiple Jira projects to include in the report.
-
Time Range: Choose the date range for which you want to view worklog data (e.g., this month, last quarter, custom).
Tip: Changing the time range or project selection will automatically refresh all visualizations and data below.
2. Summary Charts
Below the filters, the report provides a quick visual overview:
-
Total Spent Hours: Displays the total hours logged for the selected projects and period.
-
Billable vs. Non-Billable Chart: A circular (pie) chart showing the distribution between billable and non-billable hours — helping you instantly see how much of your team’s time is generating revenue.
3. Detailed Project Table
The main section of the report contains a comprehensive, interactive table summarizing time and estimation data by project.
|
Column |
Description |
|---|---|
|
Project |
Lists all Jira projects included in the report. |
|
Original Estimation |
Total of all issue estimations for issues with worklogs in the selected period. |
|
Remaining Estimation |
Sum of all remaining hours for the same set of issues. |
|
Logged Hours |
Total time logged within the selected period. |
|
Billable Ratio |
A line chart visualizing logged vs. billable hours for each project. |
|
Billable Hours |
Total billable hours logged for the project and period. |
4. Customization Options
The report table is highly flexible:
-
Add or remove columns to display only the metrics you need.
-
Group data by project, user, or other available dimensions.
-
Filter results for deeper insights (e.g., view only projects with non-billable time above a threshold).
5. Export Options
At any time, you can export the table data for further analysis or sharing:
-
CSV Export – ideal for importing into other tools or quick reviews.
-
Excel Export – preserves formatting and allows deeper data manipulation.
Summary
The Time Summary → Projects tab gives teams and managers a clear understanding of:
-
How estimated work compares to actual logged hours
-
How much of that work is billable
-
Which projects are consuming the most time
This makes it an essential report for budget tracking, billing accuracy, and project performance analysis.