The Issues tab in the Time Summary Report provides a detailed view of time logged per Jira issue, helping you analyze where effort is spent across all projects and how efficiently work progresses at the issue level.
This view is ideal for project managers and team leads who want to drill down into specific tasks, track logged hours, and compare estimates against actuals.
1. Main Filters
At the top, you can refine the report using several key filters:
-
Projects: Select one or more Jira projects to include.
-
Time Range: Choose a date range (weekly, monthly, quarterly, or custom) to define which worklogs are included.
-
Issue Filters (optional): You can further narrow the view by issue type, assignee, or status.
Tip: Adjusting filters dynamically updates the chart and issue data in real time.
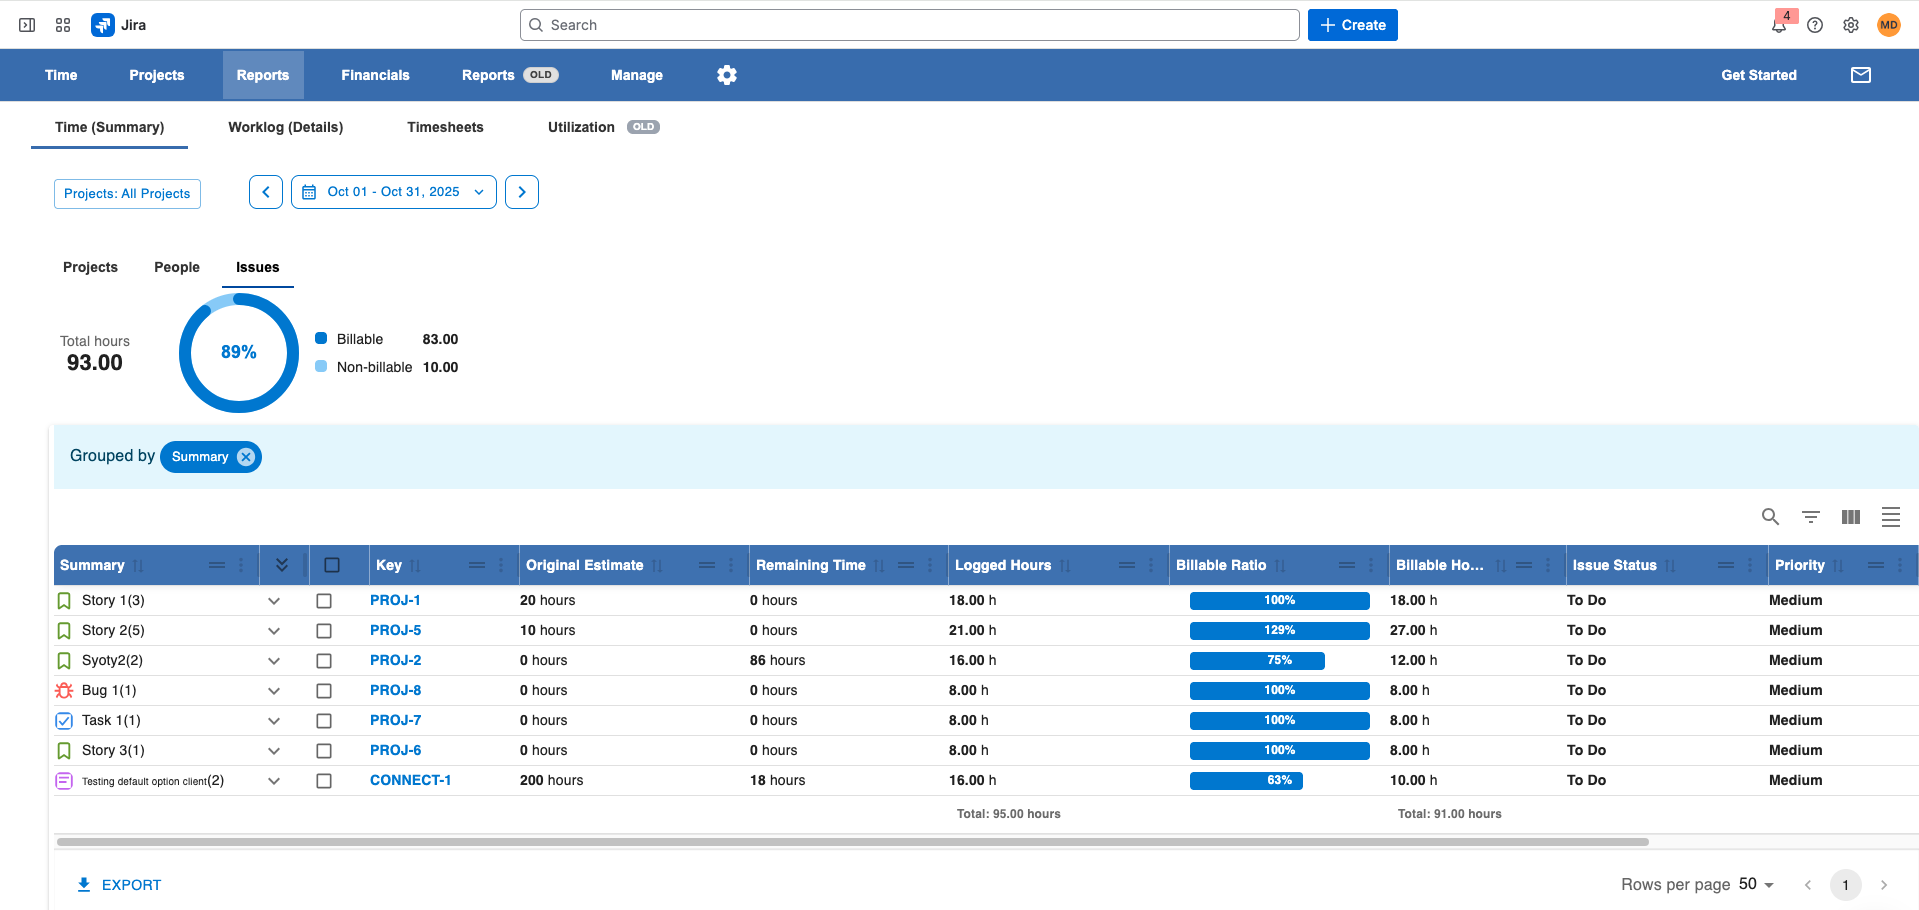
2. Summary Chart
Below the filters, you’ll find a high-level visualization showing the total time spent and billable ratio across all selected issues:
-
Total Spent Hours: The total logged time for all issues in the selected filters.
-
Billable vs Non-Billable Hours: A circular chart representing the proportion of billable vs non-billable work.
This gives you an instant overview of how team time is distributed across issues and how much of it contributes to billable work.
3. Detailed Issues Table
The table provides a granular breakdown of time per issue, including estimation metrics and billing data.
|
Column |
Description |
|---|---|
|
Issue |
Lists all Jira issues that have worklogs within the selected period. |
|
Original Estimation |
Total of all original estimates for the displayed issues. |
|
Remaining Estimation |
Sum of remaining hours for those issues. |
|
Logged Hours |
Total hours logged on the issue within the selected period. |
|
Billable Ratio |
A line chart comparing logged vs billable hours per issue. |
|
Billable Hours |
Total billable hours logged on the issue. |
|
Issue Status |
The current Jira workflow status (e.g., To Do, In Progress, Done). |
|
Issue Priority |
The priority level of the issue (e.g., High, Medium, Low). |
|
Issue Type |
Indicates if the issue is a Story, Task, Bug, Epic, etc. |
4. Customization Options
You can fully customize the issue table to focus on the most relevant metrics for your team:
-
Add or remove columns — e.g., add “Assignee”, “Labels”, or “Components.”
-
Group issues by project, assignee, or type.
-
Filter and sort by time, billable status, or estimation accuracy.
-
Apply quick searches to locate specific issues or keywords.
5. Export Options
When you’re ready to share or analyze your data further, you can export the report:
-
CSV Export — lightweight and ideal for quick data manipulation.
-
Excel Export — great for advanced analysis, pivot tables, or external reporting.
Summary
The Time Summary → Issues tab helps you:
-
See how time is distributed across individual Jira issues
-
Compare logged hours vs. estimates
-
Track issue-level billable and non-billable work
-
Monitor priorities and progress across multiple projects
This detailed issue view provides clear visibility into task-level performance, budget utilization, and time accuracy across your organization.