This guide explains where to click in Worklog360 to filter and group worklogs, and which fields (Jira, custom, and Worklog360) you can use.
Step 1: Open the Reports section
-
Go to Worklog360 → Reports
-
Choose one of the report tabs:
-
Time (Summary) – grouped totals
-
Worklogs (Details) – individual worklogs (most flexible)
-
Timesheets – timesheet-style view
-
📌 For advanced filtering and analysis, Worklogs (Details) is recommended.
Step 2: Select time range and scope
At the top of the report:
-
Set the Date range (day, week, month, or custom)
-
Set the Scope:
-
One or more Jira projects
-
A Jira filter
-
All projects
-
These settings define which worklogs are included.
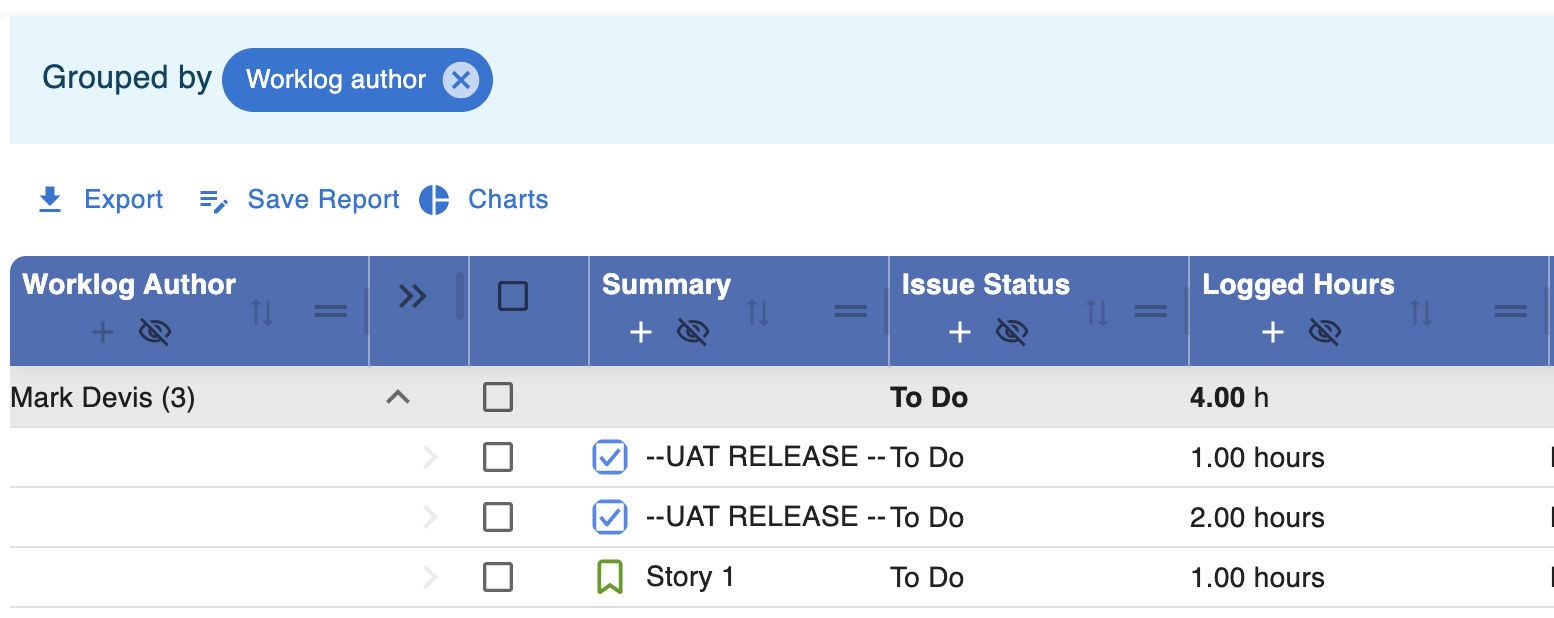
Step 3: Group worklogs
Grouping controls how worklogs are summarized.
Where to click
-
Click the “+” icon for example for “Worklog Author”
Common grouping options
You can group by:
-
User
-
Project
-
Issue
-
Account
-
Date
and any other filed that the table has !!!
📌 Grouping is also available in:
-
Time (Summary)
-
Timesheets
Step 4: Filter worklogs
Filtering controls which worklogs are shown.
Where to click
-
Click Filters

-
Add one or more filter conditions
Available filter fields
You can filter by:
-
Project
-
Issue
-
Assignee
-
Reporter
-
Issue Type
-
Status
-
Priority
-
Billable hours
-
Rate
-
Amount
-
Account
Оr Any other fields that exist as selection. custom field available on issues can be used, for example:
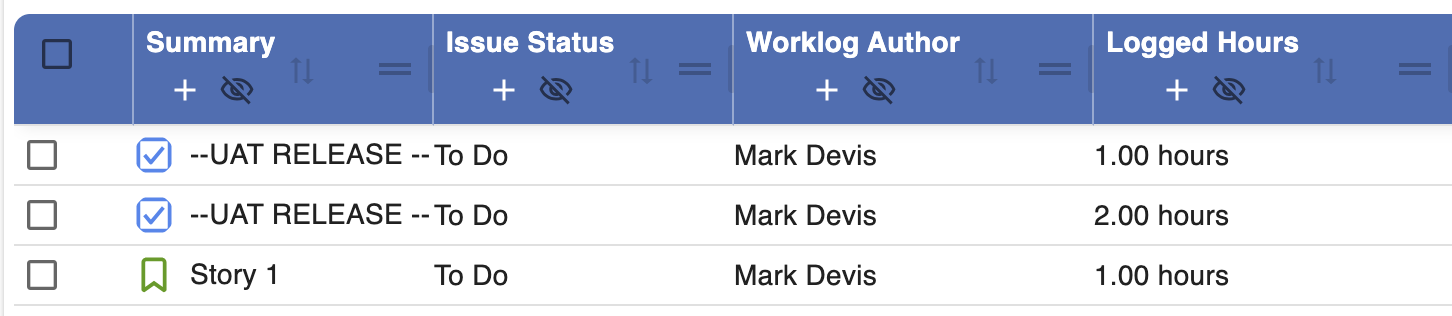
Step 5: Add columns (Worklogs Details only)
In Worklogs (Details) you can customize what data is visible.
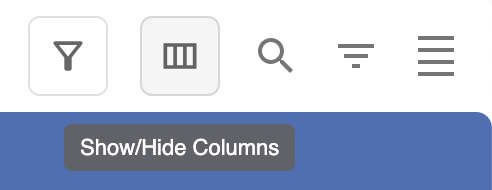
Where to click
-
Click Columns
-
Select the fields you want to display
Available columns
You can add:
-
Any Jira field or custom field
-
Any Worklog360 field:
-
Billable hours
-
Rate
-
Amount
-
Account
-
Team (if configured)
-
📌 Columns do not affect filtering — they only affect visibility.
Step 6: Combine grouping and filtering (examples)
Example 1: Billable time per user
-
Group by: User
-
Filter: Billable = Yes
-
Date range: Monthly
Example 2: Time spent on a project
-
Group by: Project
-
Filter: Project = X
-
Date range: Weekly
Example 3: Client or account analysis
-
Group by: Account
-
Filter: Account = Client A
Step 7: Save or export your view
Once configured:
-
Click Save view to reuse it later
-
Click Export to download the data (e.g. Excel)
Tips for managers
💡 Use Worklogs (Details) when you need full transparency and control.
💡 Start with grouping, then apply filters to narrow down results.
💡 Save frequently used views (e.g. monthly billing, weekly review).